Custom telecom analytics for rural regions

Meet the Speakers

Patrick Hutto
Patrick Hutto is the CEO and founder of Broadband Insights.

Sam Tripp
Sam Tripp is a Technical Account Manager at Plotly.
In this video, Patrick Hutto, founder of Broadband Insights, shares how his team uses Plotly Dash Enterprise to build and deploy telecom analytics for broadband providers. These apps help small and mid-sized ISPs solve problems typically handled by large carrier data science teams, such as asset tracking, financial modeling, network planning, and reporting, all with a leaner tech stack.
The architecture follows a traditional ETL pattern: data is collected from APIs, scripts, or webhooks, refined in a cloud-hosted PostgreSQL database, and then visualized through dashboards built in Dash. Redis is used for caching, Azure Functions for serverless compute, and Celery for background tasks like PDF generation and report snapshots.
- Dash apps consume raw JSON data and store pre-rendered reports as PDFs
- Slack and email notifications are triggered directly from the Dash UI
- Redis and Celery are built into Dash Enterprise, enabling fast, reliable workflows
- Azure scaling and Dash replicas ensure apps handle high user traffic without latency
One key use case is “Make Ready” analysis: evaluating which utility poles are viable for new broadband infrastructure. Poles vary in age, load, and condition, and replacement costs can vary dramatically. The Dash app combines map views, 3D visuals, and street view integrations to help teams plan around these constraints.
- Users can click on a map, view detailed pole data, and assess risks
- Dash wraps JavaScript libraries for 3D and chart components
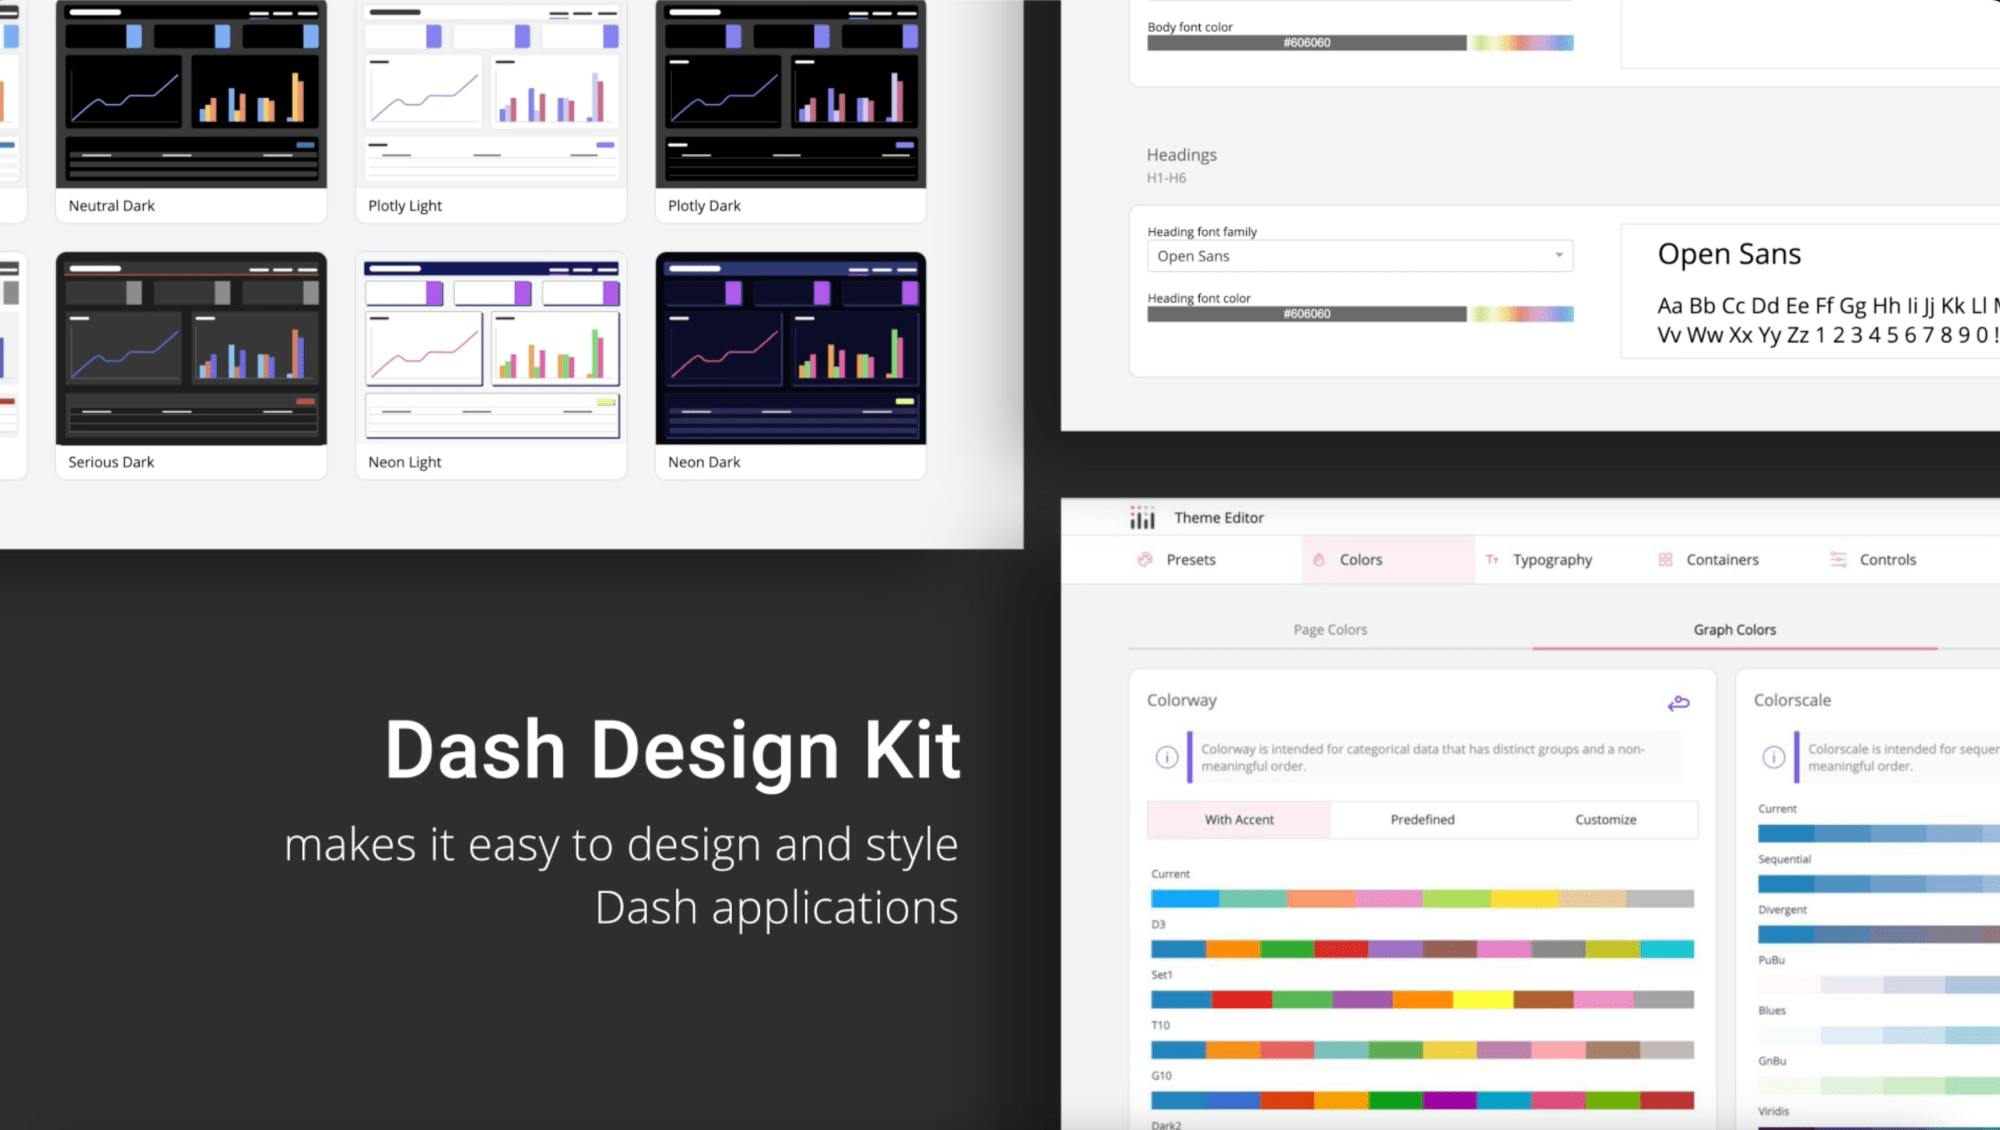
- Dash Design Kit (DDK) enables consistent theming and layout controls
- Built-in callback structure supports interactive geospatial workflows
Another major project is permit tracking. These apps help teams monitor progress across thousands of permits, highlight bottlenecks, and measure actuals against estimated SLAs. Network designs are modeled as graphs and combined with timelines, scatter plots, and KPI summaries.
- Interactive cards and charts built using DDK
- SQL-based queries populate daily, weekly, and monthly reports
- Data is cached for performance, with drilldowns available on click
- Visualizations help teams prioritize efforts and optimize timelines
The newest addition is Plotly AI chatbot functionality using Dash’s built-in Chatbot Builder. Broadband Insights integrated a custom model tuned for SQL generation. Users can ask natural language questions and either get the raw SQL for download or receive summarized insights directly from cached data.
- Chatbot UI works out of the box with no styling required
- Backend logic connected easily through standard Dash callbacks
- Model trained using AMA, specialized for structured query generation
- Use cases include spreadsheet-style exports and executive summaries
Implementing this system helped reduce new customer installation timelines from 60–90 days to under a week. Automation also cut significant manual labor from legacy reporting workflows.
- Reporting pipeline runs end-to-end without manual CSV exports
- Dash replaces tools like PowerBI and Looker for many users
- Read-only access enables broader data visibility without extra licenses
- Dramatic operational efficiency gains from real-time insights
Watch the video to follow along with the architecture, demos, and use cases.