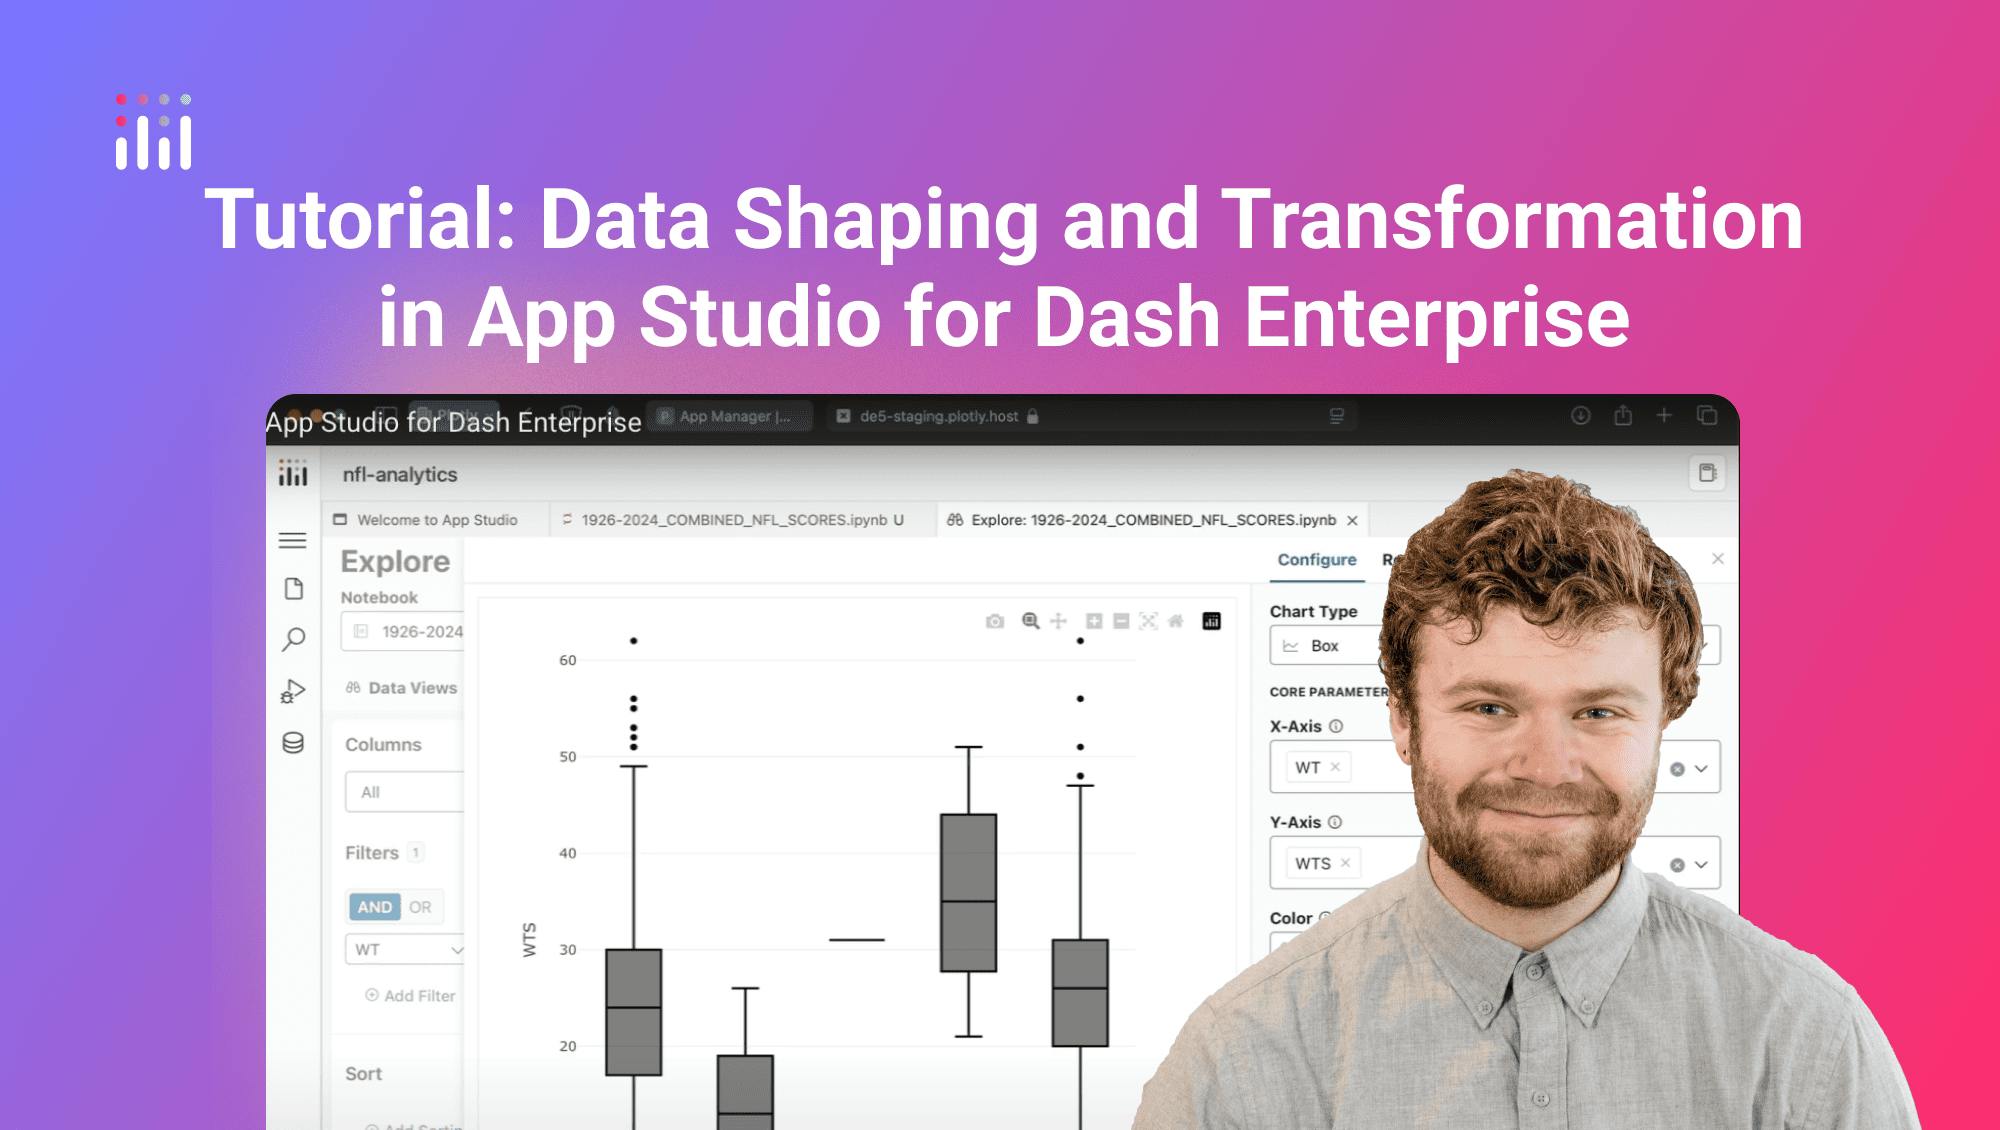
Tutorial: Data shaping and transformation in App Studio for Dash Enterprise
Meet the Speaker

Nathan Drezner
Nathan Drezner is a Product Manager at Plotly.
In this video, Nathan Drezner from Plotly introduces the new table editor and transform library in App Studio. These updates make it easier to shape and analyze data interactively before visualizing it, while still keeping everything backed by editable Python code.
The table editor is built for fast exploration of large datasets. In this example, Nathan works with an NFL scores dataset spanning nearly 100 years, containing over 170,000 rows. The new filtering and grouping interface lets users shape data without writing code directly.
Key features demonstrated include
- Filtering by column values using partial string matches, such as finding games where the winning team contains "New York"
- Grouping records by game type to compare playoff and regular season performance
- Selecting aggregation functions like average or count based on column type
- Live preview of filtered data and summary statistics in the table interface
All user actions in the editor are automatically converted into Python code using the new transform library. This code is inserted into the notebook so users can inspect, modify, or reuse it. The transform syntax is flexible but currently low-level, with plans to simplify it into a Plotly Express-style API.
Nathan then moves into the chart editor, where filtered and grouped data is passed directly into chart creation. He builds a box plot showing winning team scores by team, filtered down to New York teams, and switches between chart types interactively. Like the table editor, the chart editor also outputs code, combining data transformation and visualization in a streamlined workflow.
The combination of table exploration, transform code generation, and UI-based chart building makes it easier to go from raw data to production-ready dashboards. Watch the video to see how the table editor and transform library help you build visualizations quickly while maintaining full control of your code.