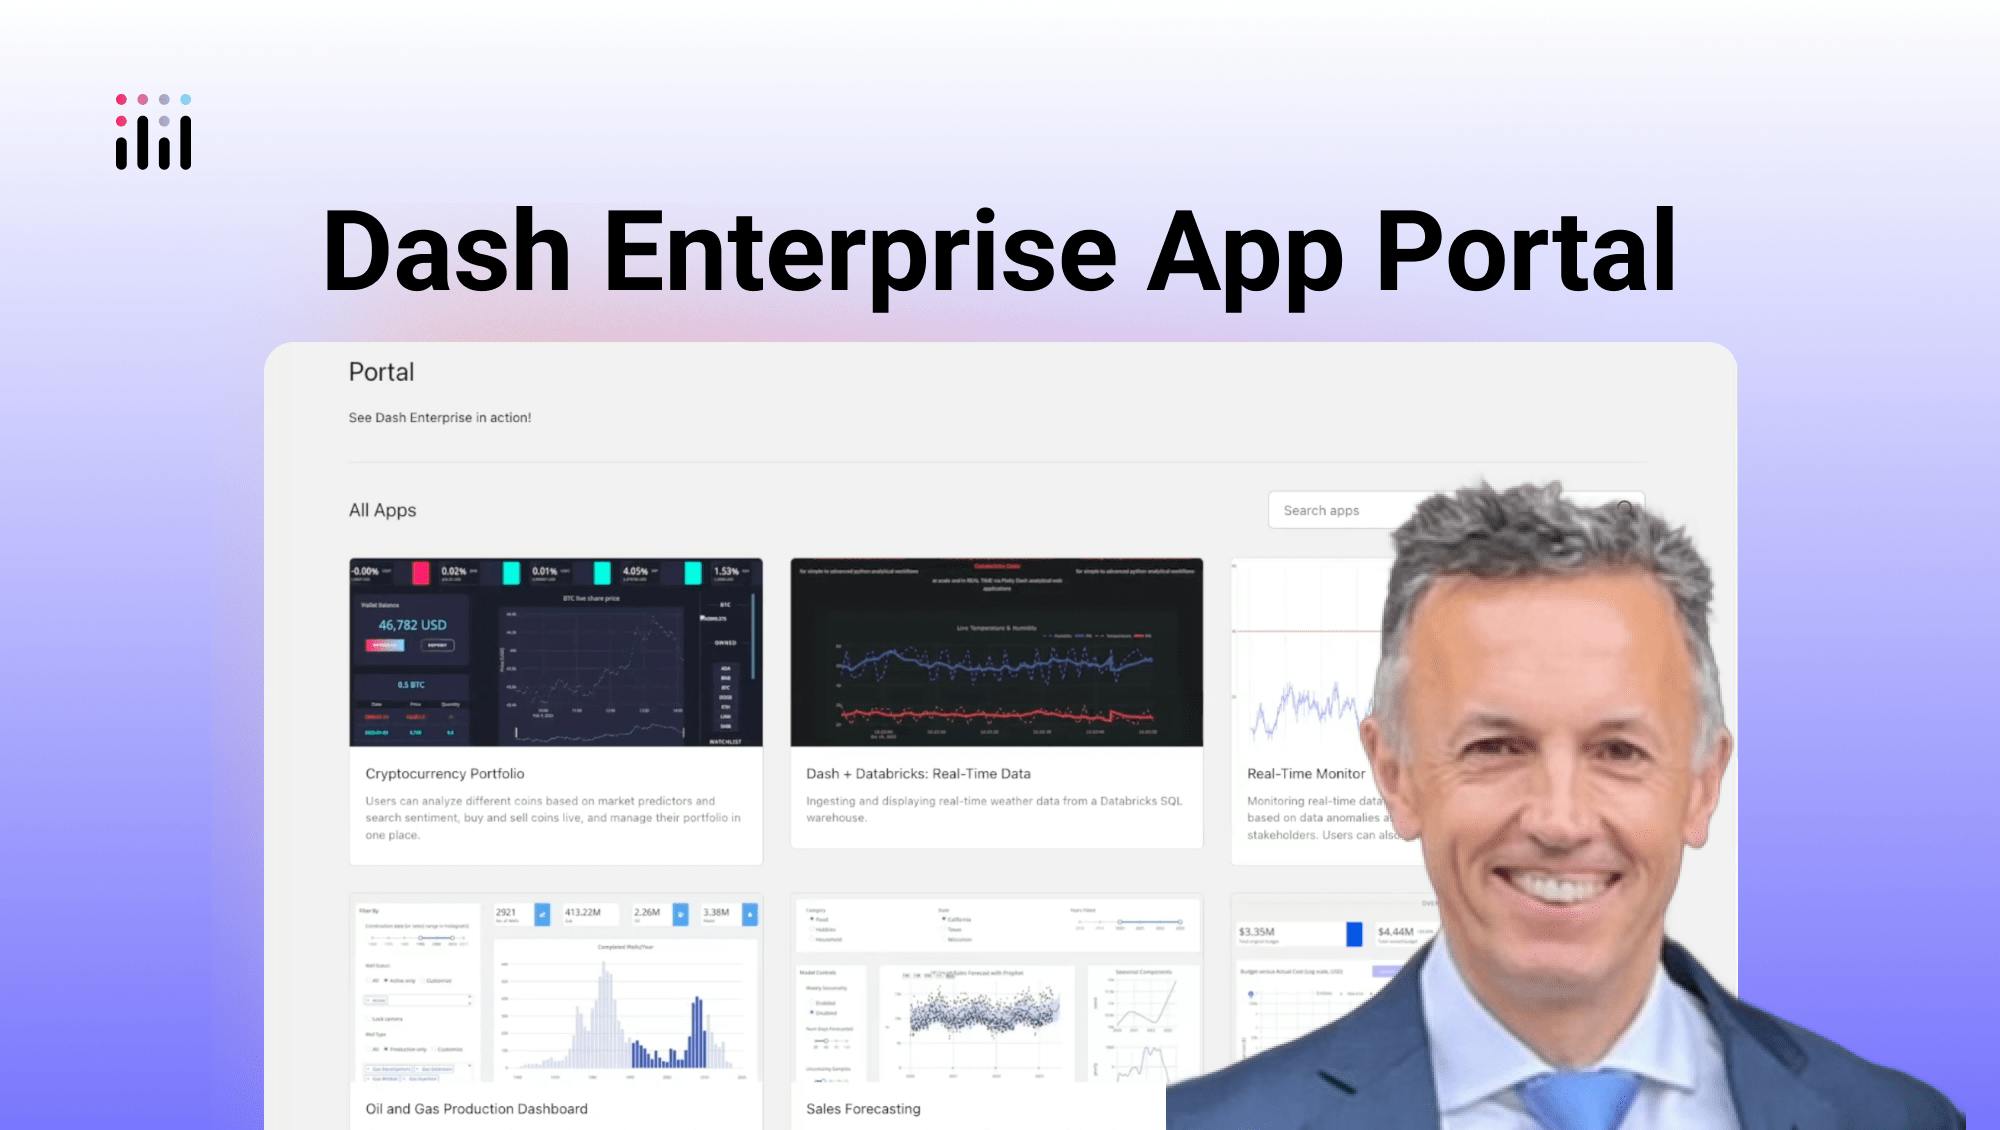
Quick intro to Dash Enterprise App Portal
Meet the Speaker

Andy Wisbey
Andy Wisbey is a Plotly Sales Director based in the UK.
The Dash Enterprise App Portal gives users a centralized place to access, interact with, and act on their data through applications built on Dash. Unlike SaaS dashboards, Dash is hosted entirely within your organization's infrastructure. Authentication integrates with enterprise systems like Entra ID, Okta, Azure AD, or Ping, giving each user access to only the apps they're entitled to.
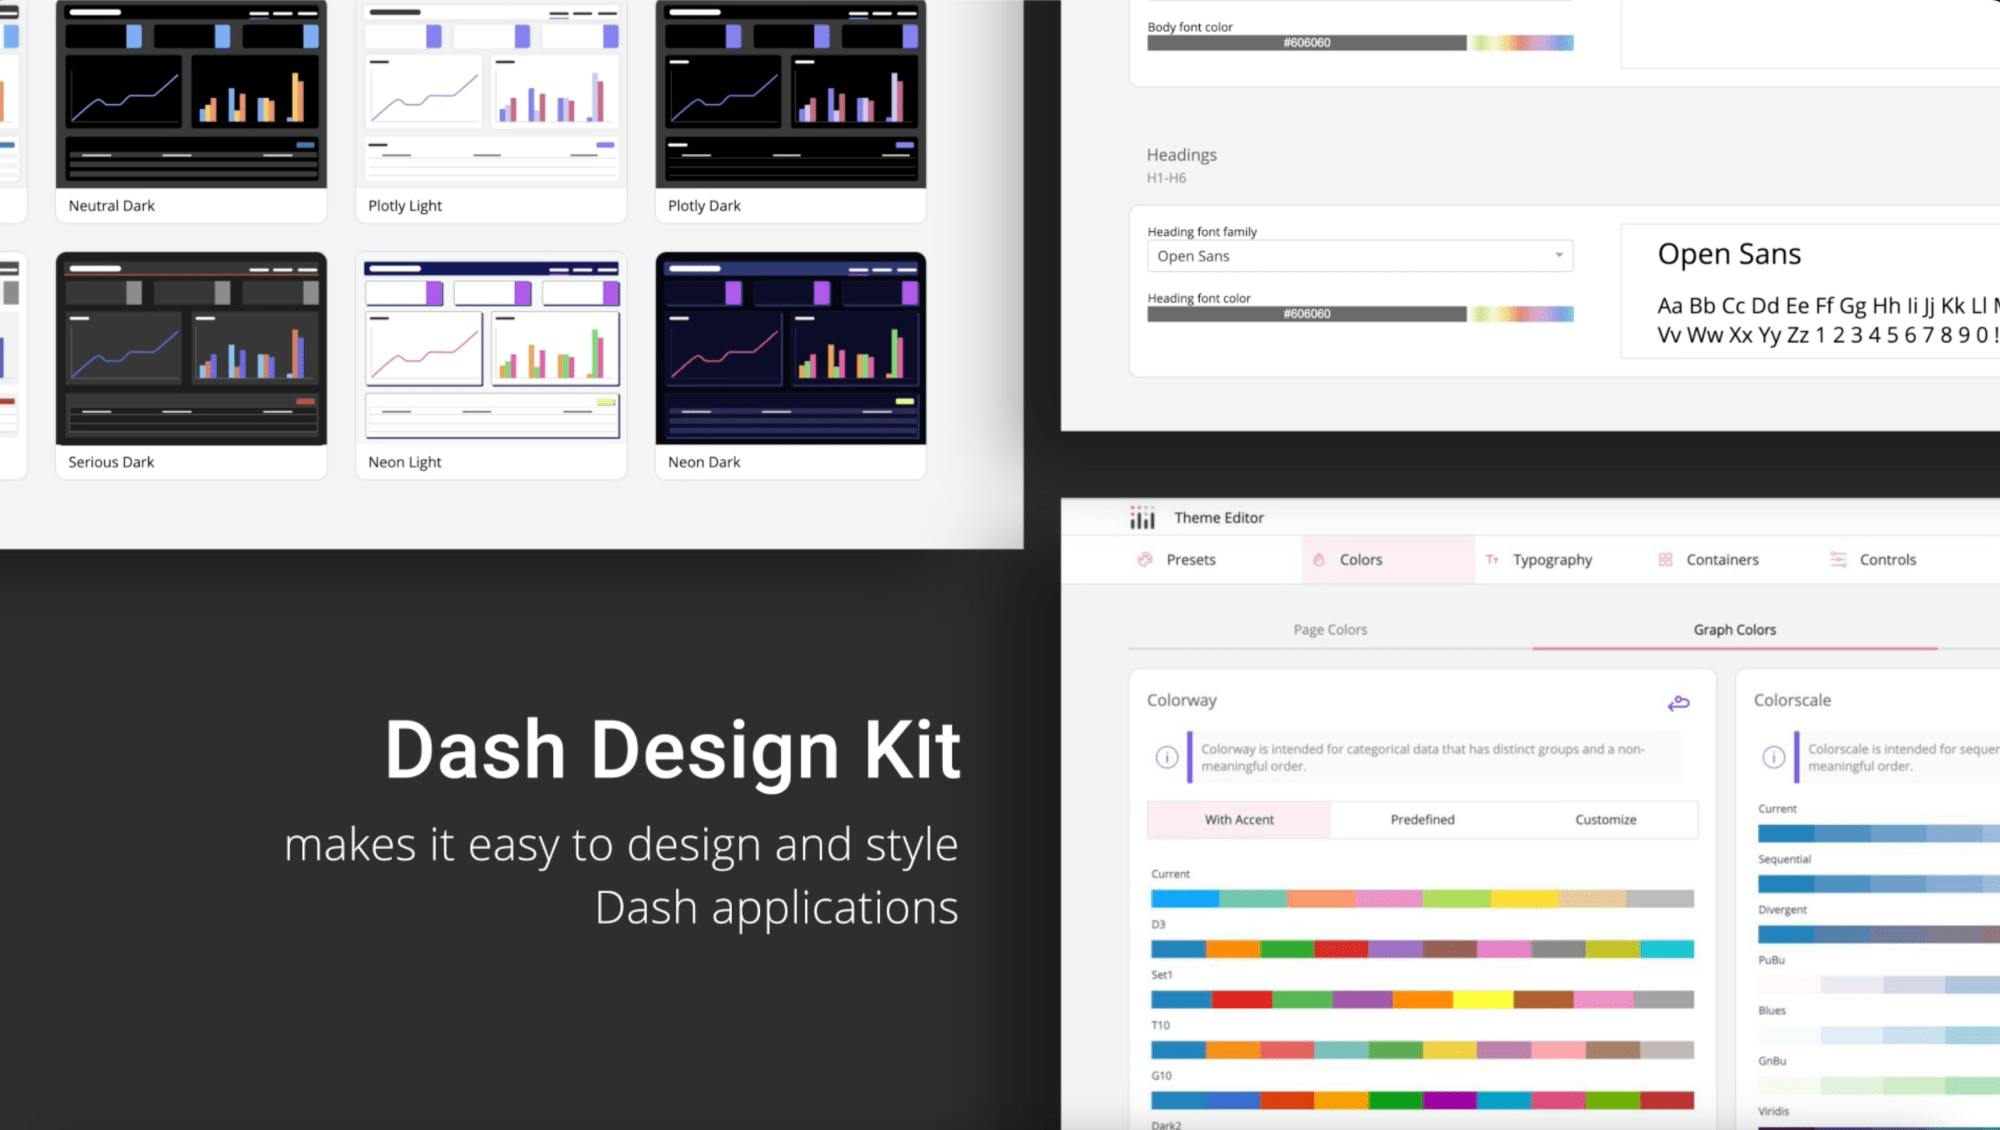
Once logged in, users can explore interactive Dash applications made up of Plotly components and tools like AG Grid, which is popular for financial data. These are not static dashboards. Users can filter, sort, zoom, and select data in real time, triggering updates to visualizations, tables, or workflows without needing to refresh the page.
- Applications are fully interactive and support dynamic filtering and cross-component updates
- Can include components outside Plotly such as AG Grid for tabular data
- Hosted within your environment for full control and security
- Tightly integrated with enterprise authentication systems
Dash apps support full interactivity with APIs, models, and databases. For example, users can initiate actions like transferring funds or triggering a machine learning model directly from the UI. A sales forecasting app demonstrates how models can be dynamically rerun based on user selections, with controls for seasonal or event-based adjustments like COVID.
- Apps support API calls, database writes, and ML model execution
- Forecasting models adjust in real time based on user-selected inputs
- Logic and interactivity are embedded directly in the UI
- Applications can be used for decision-making, not just monitoring
The portal also supports report generation. Users can create static PDFs or dynamic interactive reports that mirror the original application but remain live. Reports can be scheduled for regular updates and pushed via email or messaging tools when thresholds are met. This is particularly useful for real-time monitoring scenarios.
- Static and interactive reports can be generated with a click
- Reports can auto-refresh and be sent on a schedule
- Real-time use cases like monitoring can trigger alerts with embedded reports
- Reports retain interactivity when needed for deeper analysis
A final layer of functionality is smart insights powered by large language models. Dash apps can be linked to internal or external LLMs, offering contextual explanations, identifying anomalies, or highlighting trends directly within the visual interface. This helps non-technical users interpret data more easily and make informed decisions.
- LLM integration adds contextual analysis to charts
- Insights are accessible through a simple UI button
- Models can run on-prem or in the cloud
- Enhances usability for non-expert users
Watch the video to follow along and see how Dash Enterprise turns data apps into interactive decision platforms for modern organizations.